> ## Documentation Index
> Fetch the complete documentation index at: https://docs.property-genius.co/llms.txt
> Use this file to discover all available pages before exploring further.
# Statistics
The Statistics page provides performance analytics and insights, helping you compare your portfolio with the average investor.
## Statistics Dashboard
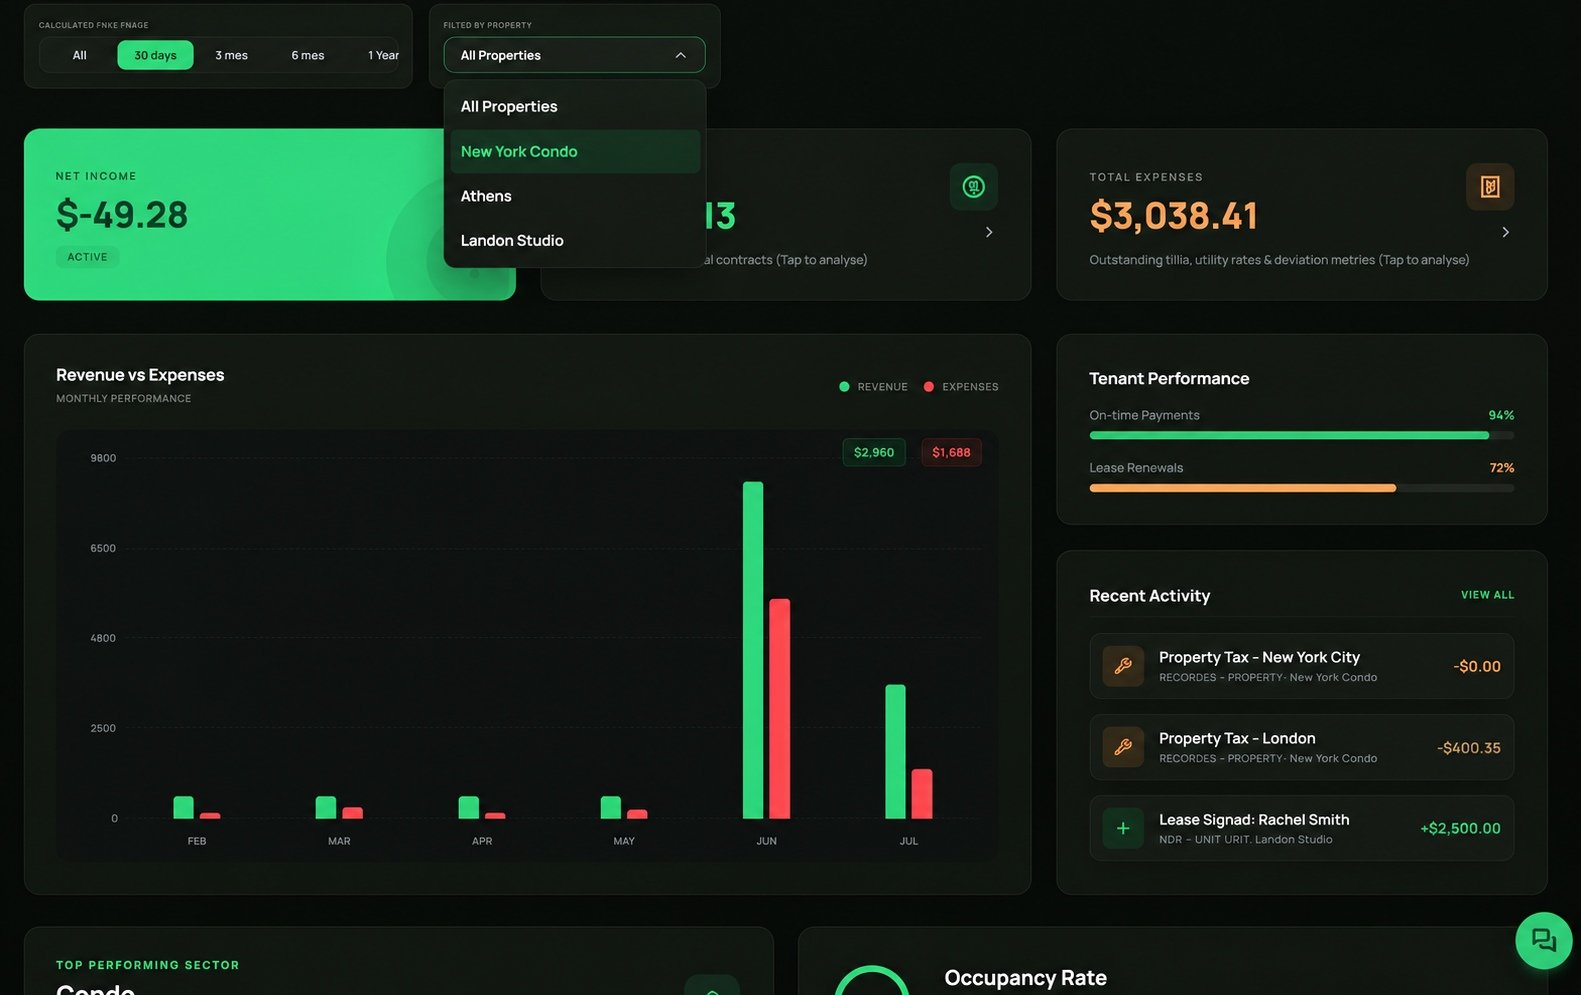
The **Statistics** dashboard provides a high-level overview of your portfolio's performance.
Filter the data by relevant segments to gain actionable insights and monitor key metrics, including:
* **Income, Revenue & Expenses** - Analyze your properties' financial performance over time.
* **Tenant Performance** - Track tenant activity, rental income, and payment trends.
* **Occupancy Rate** - Monitor occupancy levels and rental performance over time.
* **Ready Phase Insights** - Discover AI-generated insights for properties in the **Ready** phase to help optimize your investment decisions.
 **Currency Display**
* If your properties use **different currencies**, and the **All Properties** filter is selected, all statistics are automatically converted and displayed in **USD (\$)**.
* If **all properties use the same currency** (for example, **EUR**), all statistics will be displayed in that currency instead of USD.
* When viewing a **specific property**, all statistics are displayed in the currency assigned to that property.
## **Net Revenue Detailed Analysis**
Clicking on the 'Net Revenue' option on the Statistics Dashboard screen will navigate you to the 'Net Revenue Detailed Analysis' page.
**Currency Display**
* If your properties use **different currencies**, and the **All Properties** filter is selected, all statistics are automatically converted and displayed in **USD (\$)**.
* If **all properties use the same currency** (for example, **EUR**), all statistics will be displayed in that currency instead of USD.
* When viewing a **specific property**, all statistics are displayed in the currency assigned to that property.
## **Net Revenue Detailed Analysis**
Clicking on the 'Net Revenue' option on the Statistics Dashboard screen will navigate you to the 'Net Revenue Detailed Analysis' page.
 Review detailed analytical information related to your payouts, income and revenue.
Learn which property is the most profitable.
Which period was the most profitable.
Did you make more money from short term or long term?
Compare between external accomodation platforms you use - which provided more money?
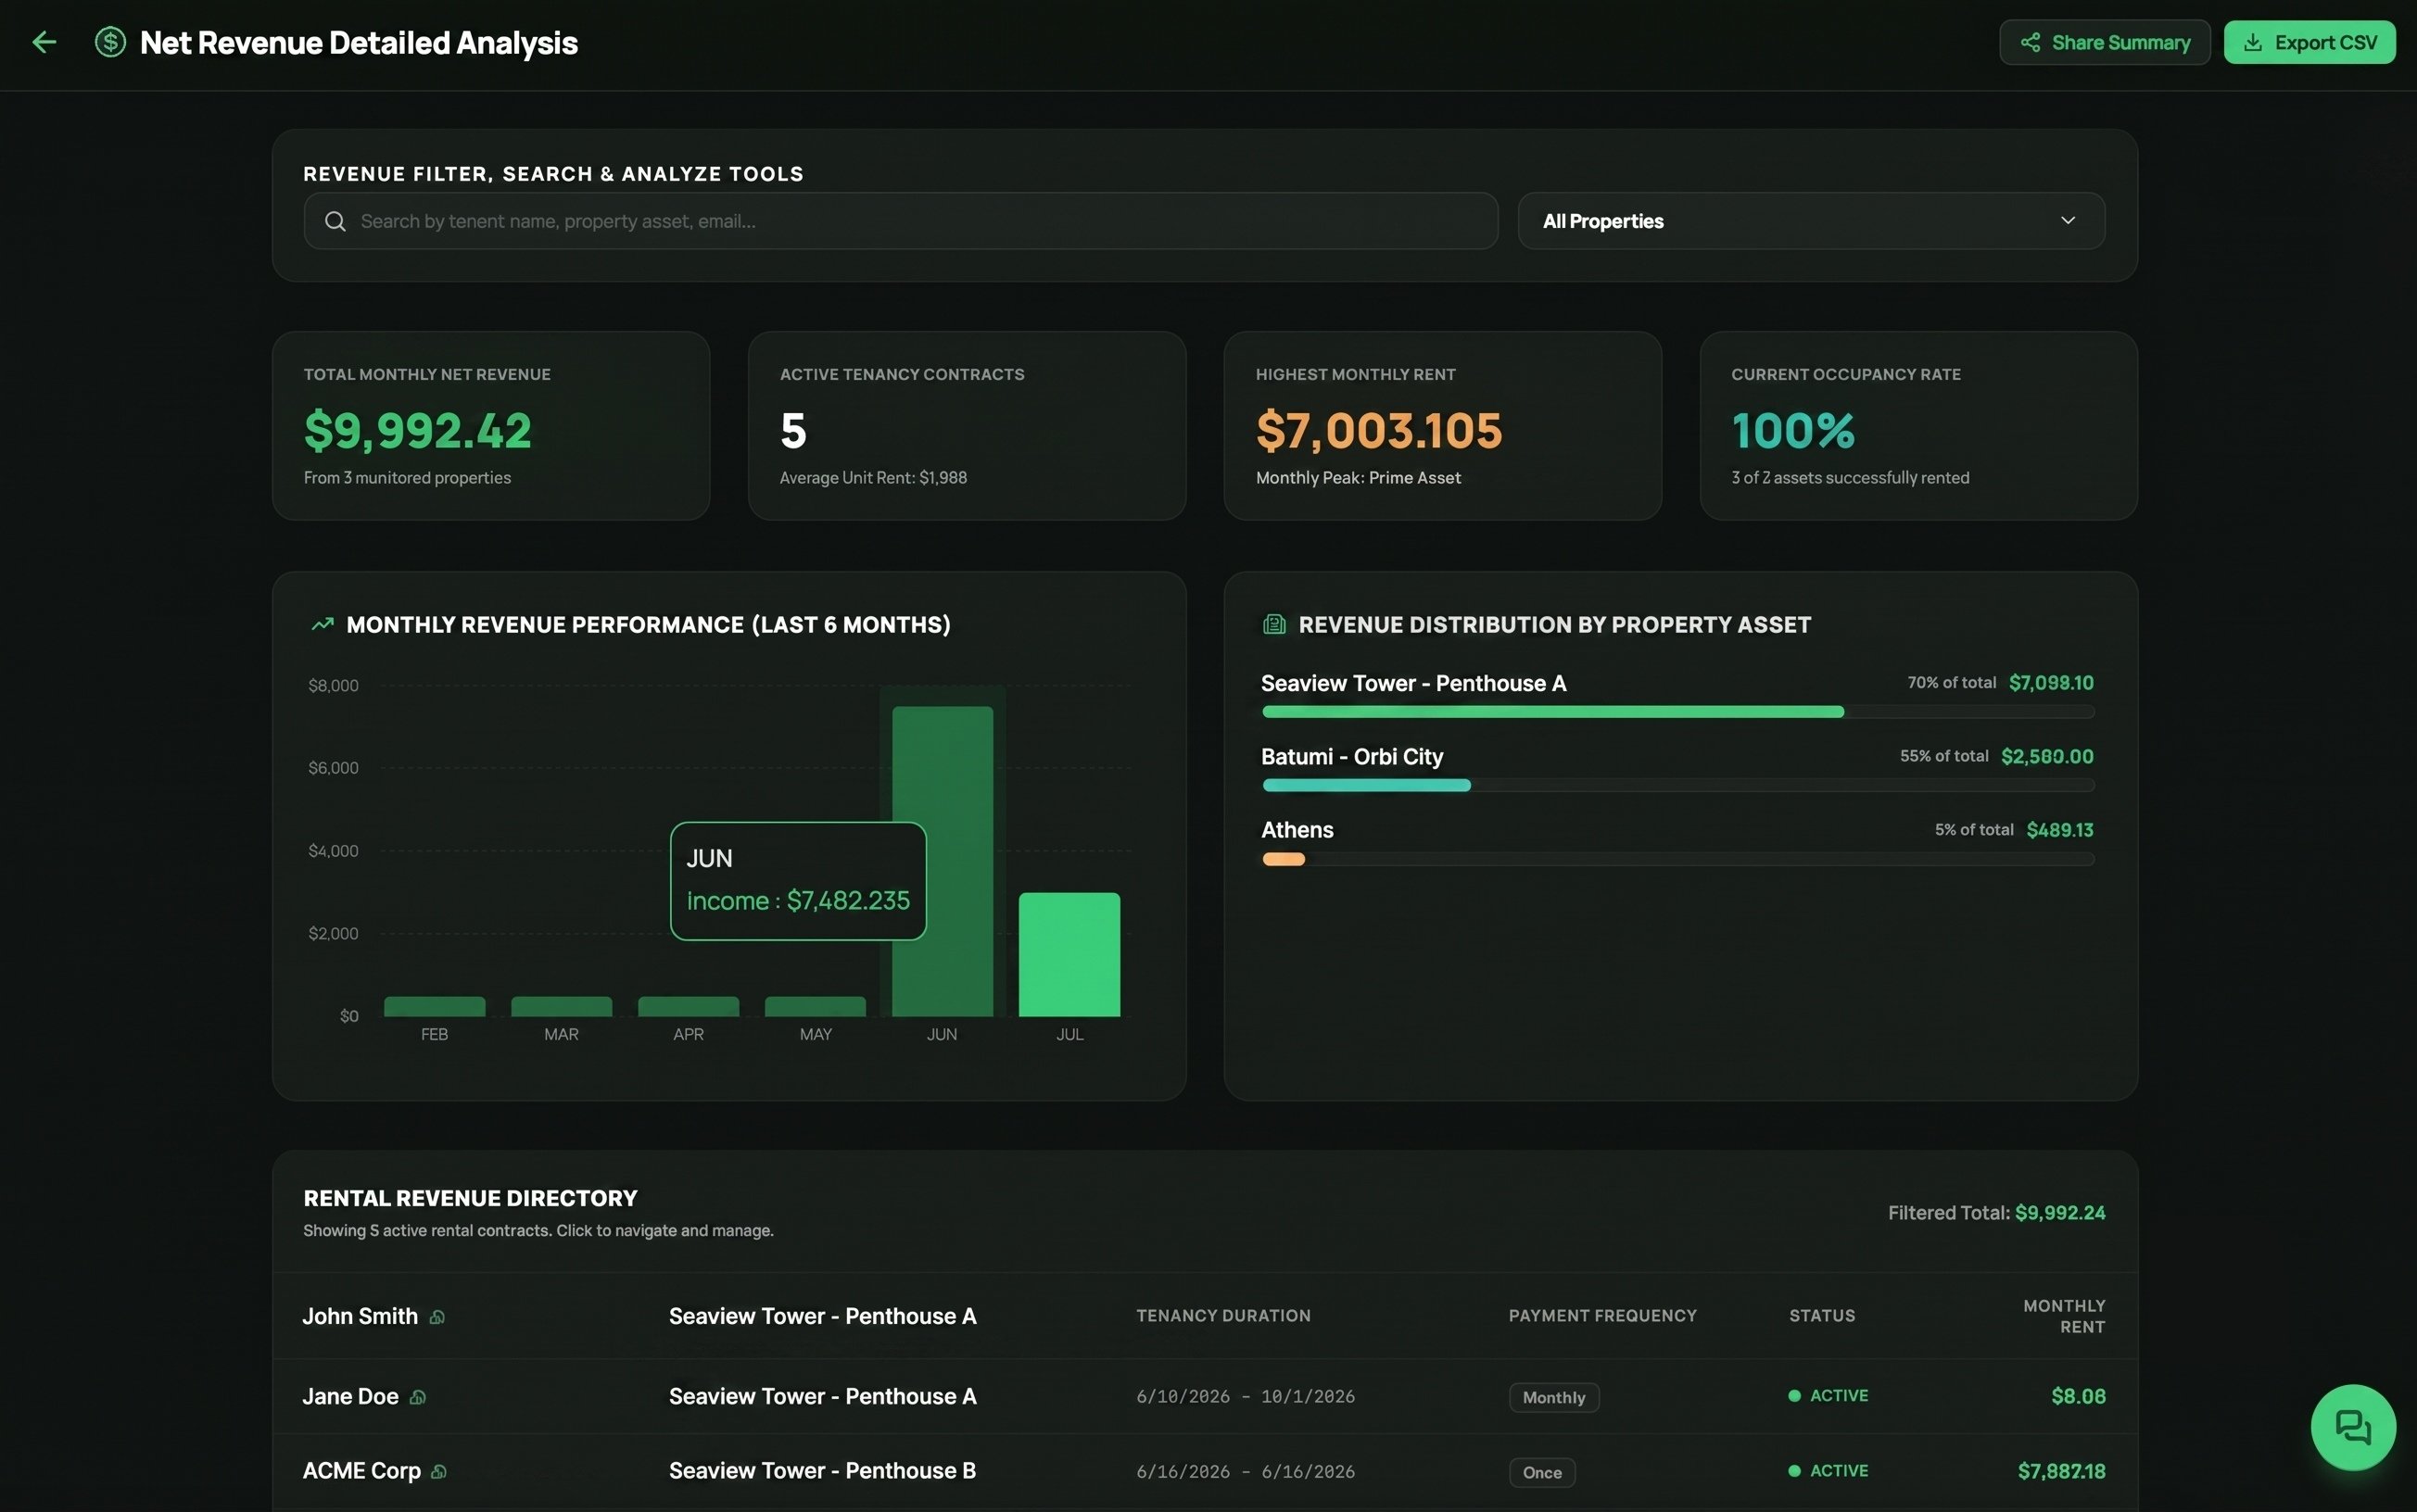
The **Net Revenue Detailed Analysis** page provides a comprehensive view of your rental income and property performance, helping you identify trends and maximize profitability.
Use this page to:
* Review detailed insights into your **income, payouts, and net revenue**.
* Identify your **highest-performing properties** based on generated revenue.
* Discover **which months or periods were the most profitable**.
* Compare the performance of **short-term and long-term rentals**.
* Analyze revenue generated from **different booking platforms** (such as Airbnb, Booking.com, Agoda, and others) to determine which channels deliver the highest returns.
* Filter and search revenue by **property, tenant, or contract** for more focused analysis.
The dashboard also provides valuable business insights, including:
* **Total Monthly Net Revenue** across your selected properties.
* **Active Rental Contracts** and the average monthly rent.
* Your **highest monthly rental income** and the property generating it.
* **Current Occupancy Rate** to help monitor portfolio utilization.
* **Monthly Revenue Trends** with interactive charts for identifying seasonal patterns, growth, or declining performance.
* **Revenue Distribution by Property**, allowing you to quickly compare how much each property contributes to your total income.
* A detailed **Rental Revenue Directory** showing each active tenancy, including:
* Tenant information
* Assigned property
* Contract duration
* Payment frequency
* Contract status
* Monthly rent amount
Additional capabilities include:
* Search and filter analytics by property or tenant.
* Export the displayed data to CSV for external reporting and accounting.
* Share a summarized revenue report with partners, investors, or team members.
* Monitor occupancy alongside revenue to understand whether vacancies are affecting profitability.
* Compare properties side by side to identify underperforming assets and opportunities for improvement.
* Track recurring versus one-time rental payments.
* Measure the financial contribution of each property to your overall portfolio, helping prioritize investments and renovation decisions.
This page enables you to make data-driven decisions about pricing, occupancy, marketing channels, and property investments, giving you a clear understanding of where your rental business is performing best and where improvements can increase revenue.
## **Expenses Detailed Analysis & Deviation**
Clicking on the 'Total Expenses' option on the Statistics Dashboard screen will navigate you to the 'Expenses Detailed Analysus Deviation' page.
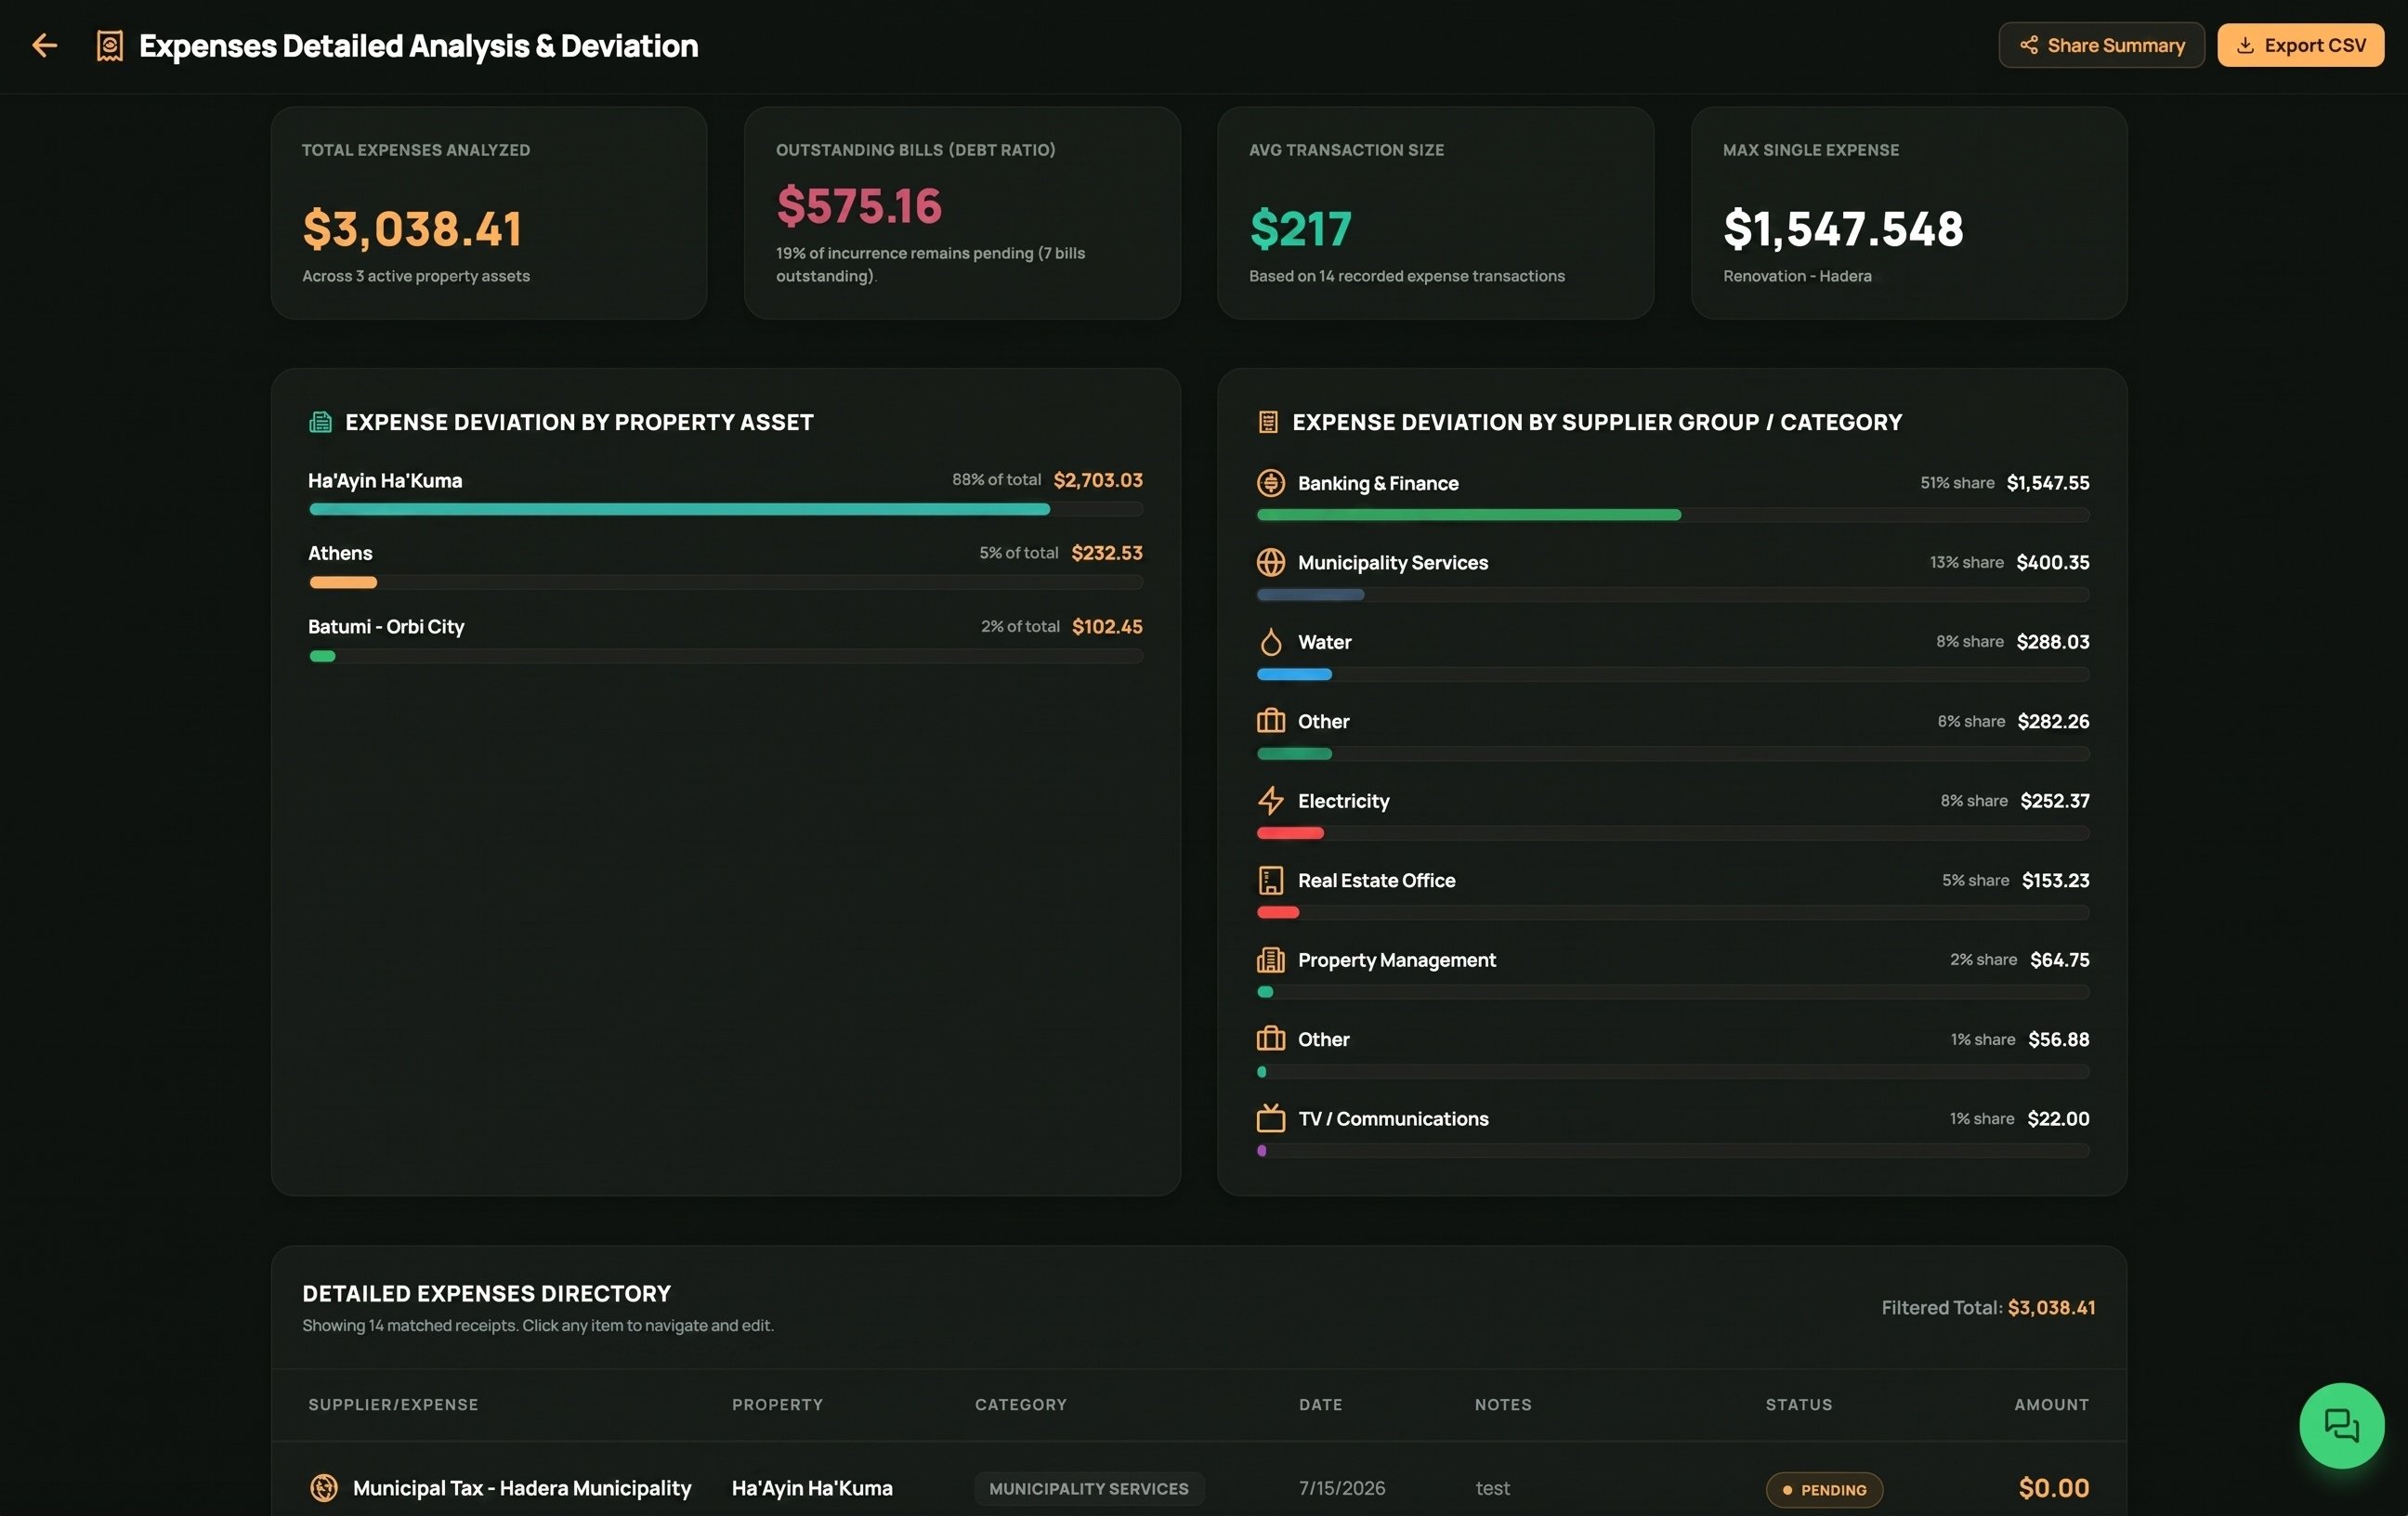 The **Expenses Detailed Analysis & Deviation** page gives you a complete overview of your property expenses, helping you understand where your money is being spent, identify cost trends, and control your operating budget.
Use this page to:
* Review detailed insights into **property expenses, bills, and operating costs**.
* Identify **which properties generate the highest expenses**.
* Discover **which expense categories consume the largest portion of your budget**.
* Monitor **outstanding bills and pending payments** to avoid missed due dates.
* Analyze spending by **supplier, service provider, or expense category**.
* Search and filter expenses by **property, supplier, category, or date** for focused analysis.
The dashboard also provides valuable financial insights, including:
* **Total Expenses Analyzed** across your selected properties.
* **Outstanding Bills (Debt Ratio)** showing pending payments and unpaid expenses.
* **Average Transaction Size** to understand your typical expense amount.
* **Largest Single Expense** recorded during the selected period.
* **Expense Distribution by Property**, allowing you to quickly identify which assets require the highest operating costs.
* **Expense Distribution by Category**, showing where your budget is allocated (such as Banking & Finance, Utilities, Municipality Services, Property Management, Maintenance, and more).
* A detailed **Expenses Directory** listing every expense, including:
* Supplier or vendor
* Related property
* Expense category
* Expense date
* Notes
* Payment status (Paid, Pending, etc.)
* Expense amount
This page also helps you answer important business questions, such as:
* Which property is **the most expensive to maintain**?
* Which **expense categories** consume the largest share of my budget?
* How much money is currently tied up in **unpaid bills**?
* Which suppliers or service providers receive the highest payments?
* Are my expenses increasing or decreasing over time?
* Which properties generate unusually high operating costs?
* Where can I reduce expenses to improve overall profitability?
* Are maintenance, utilities, taxes, or management fees driving most of my costs?
Additional capabilities include:
* Compare operating costs across multiple properties.
* Identify spending patterns and unusual expense deviations.
* Monitor recurring versus one-time expenses.
* Track pending invoices and outstanding payments.
* Export expense data to CSV for accounting, bookkeeping, or tax reporting.
* Share a summarized expense report with partners, accountants, or investors.
* Filter analytics to focus on specific properties, expense categories, or suppliers.
By combining expense breakdowns, outstanding liabilities, and detailed transaction records, this page helps you make informed budgeting decisions, reduce unnecessary costs, and maximize the profitability of your real estate portfolio.
The **Expenses Detailed Analysis & Deviation** page gives you a complete overview of your property expenses, helping you understand where your money is being spent, identify cost trends, and control your operating budget.
Use this page to:
* Review detailed insights into **property expenses, bills, and operating costs**.
* Identify **which properties generate the highest expenses**.
* Discover **which expense categories consume the largest portion of your budget**.
* Monitor **outstanding bills and pending payments** to avoid missed due dates.
* Analyze spending by **supplier, service provider, or expense category**.
* Search and filter expenses by **property, supplier, category, or date** for focused analysis.
The dashboard also provides valuable financial insights, including:
* **Total Expenses Analyzed** across your selected properties.
* **Outstanding Bills (Debt Ratio)** showing pending payments and unpaid expenses.
* **Average Transaction Size** to understand your typical expense amount.
* **Largest Single Expense** recorded during the selected period.
* **Expense Distribution by Property**, allowing you to quickly identify which assets require the highest operating costs.
* **Expense Distribution by Category**, showing where your budget is allocated (such as Banking & Finance, Utilities, Municipality Services, Property Management, Maintenance, and more).
* A detailed **Expenses Directory** listing every expense, including:
* Supplier or vendor
* Related property
* Expense category
* Expense date
* Notes
* Payment status (Paid, Pending, etc.)
* Expense amount
This page also helps you answer important business questions, such as:
* Which property is **the most expensive to maintain**?
* Which **expense categories** consume the largest share of my budget?
* How much money is currently tied up in **unpaid bills**?
* Which suppliers or service providers receive the highest payments?
* Are my expenses increasing or decreasing over time?
* Which properties generate unusually high operating costs?
* Where can I reduce expenses to improve overall profitability?
* Are maintenance, utilities, taxes, or management fees driving most of my costs?
Additional capabilities include:
* Compare operating costs across multiple properties.
* Identify spending patterns and unusual expense deviations.
* Monitor recurring versus one-time expenses.
* Track pending invoices and outstanding payments.
* Export expense data to CSV for accounting, bookkeeping, or tax reporting.
* Share a summarized expense report with partners, accountants, or investors.
* Filter analytics to focus on specific properties, expense categories, or suppliers.
By combining expense breakdowns, outstanding liabilities, and detailed transaction records, this page helps you make informed budgeting decisions, reduce unnecessary costs, and maximize the profitability of your real estate portfolio.